Homework #9
This homework is intended to introduce you to the gdb debugger,
understand how to examine and update memory locations gdb, and gain
experience with how the runtime stack is organized.
In addition to the lecture material, you can watch this introductory video on buffer overflow attacks.
The file examine_stack.c makes a series of function calls main → freshman → sophomore → junior → senior. Compile the program and run it in the debugger, breaking somewhere in function senior. Print out all of the stack activation frames, and label as many memory locations as you can.
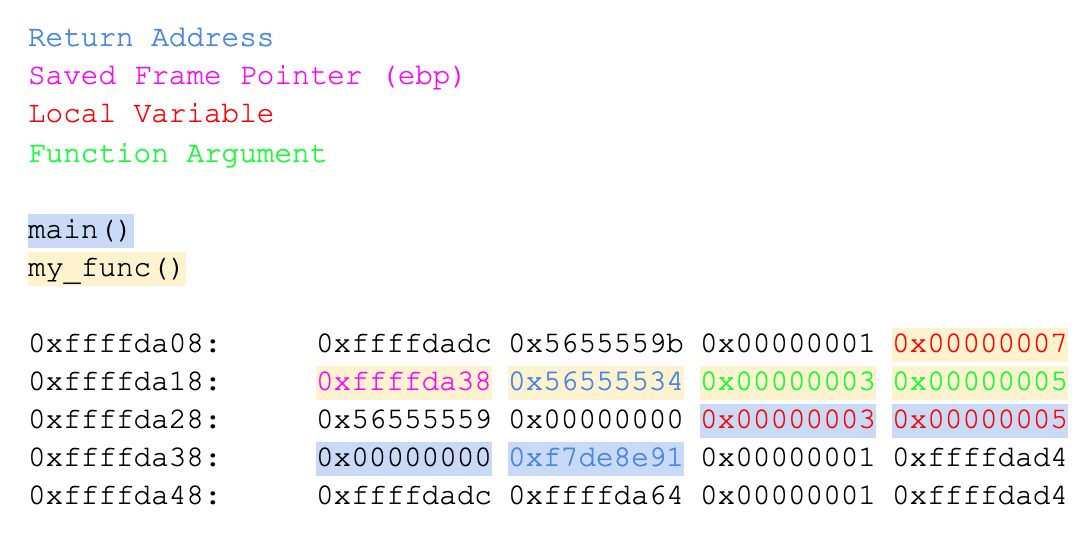
Not all the stack locations will be labeled. Extra space may be allocated on the stack that is set to uninitialized values that already existing in memory. Be sure to label the following elements for all four functions. You should be able to identify
- return addresses
- saved frame pointers (ebp)
- local variables
- function arguments
For example, if you had a function that looked like this:
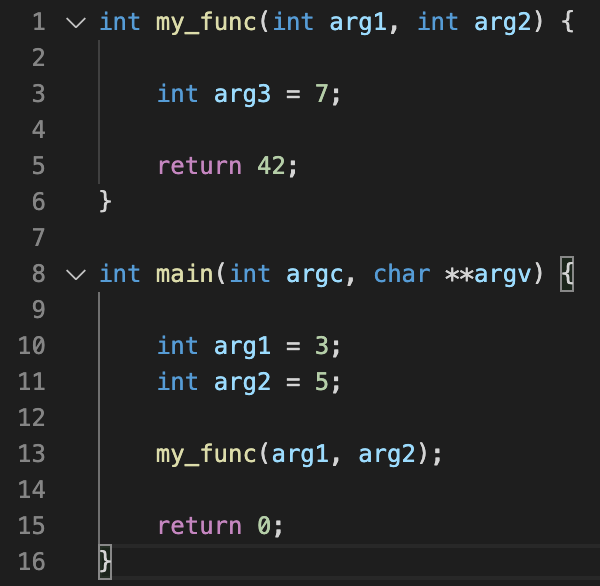
Then you might label things like this:
Use the “info frame” gdb command to compare the information you labeled with what the debugger reports is in each stack frame. You may print out a hard copy, write on it to label all the items, and turn in a scan of the hard copy. You may also create your result electronically. Make it easy for the TAs to grade.
Compile the program with the -m32 compiler option. We will use a 32-bit program for simplicity. You should also compile with -g to give debugging info.
Useful GDB Debugger Commands
See this cheat sheat.
// start debugger from the command line
gdb [executable name]
// list source code, hit [enter] to list more
(gdb) list 1
// set break point at line 10
(gdb) break 10
// start running program, enter parameters
(gdb) run [parameters]
// execute the next line of code and pause
(gdb) step
// display values of registers or variables
(gdb) print $esp
// examine a block (32 words) of memory in hex
(gdb) x /32xw [address]
// change the value of a memory address pointer
(gdb) set (int )[addr] = [val]
// see the assembly code stored in memory
(gdb) disassemble main
Submission
Submit a PDF via Learning Suite.